
Everything About The Mobile App Market
Infographic Of The Day
Everything you hear about these days is mobile-app this and mobile-app that. But what does the mobile-app market look like? What do people want from apps? And what does the competitive landscape look like when you compare iPhone to Windows to Android?
Lucky for you, we have answers, thanks to James West of GDS Infographics, who created this superb collection of facts and figures for the iStrategy conference. Let's dive in.
Games are obviously the killer app of the mobile market--64% of people who pay for an app also download a game; other popular ones include social networking, weather, entertainment, and banking:
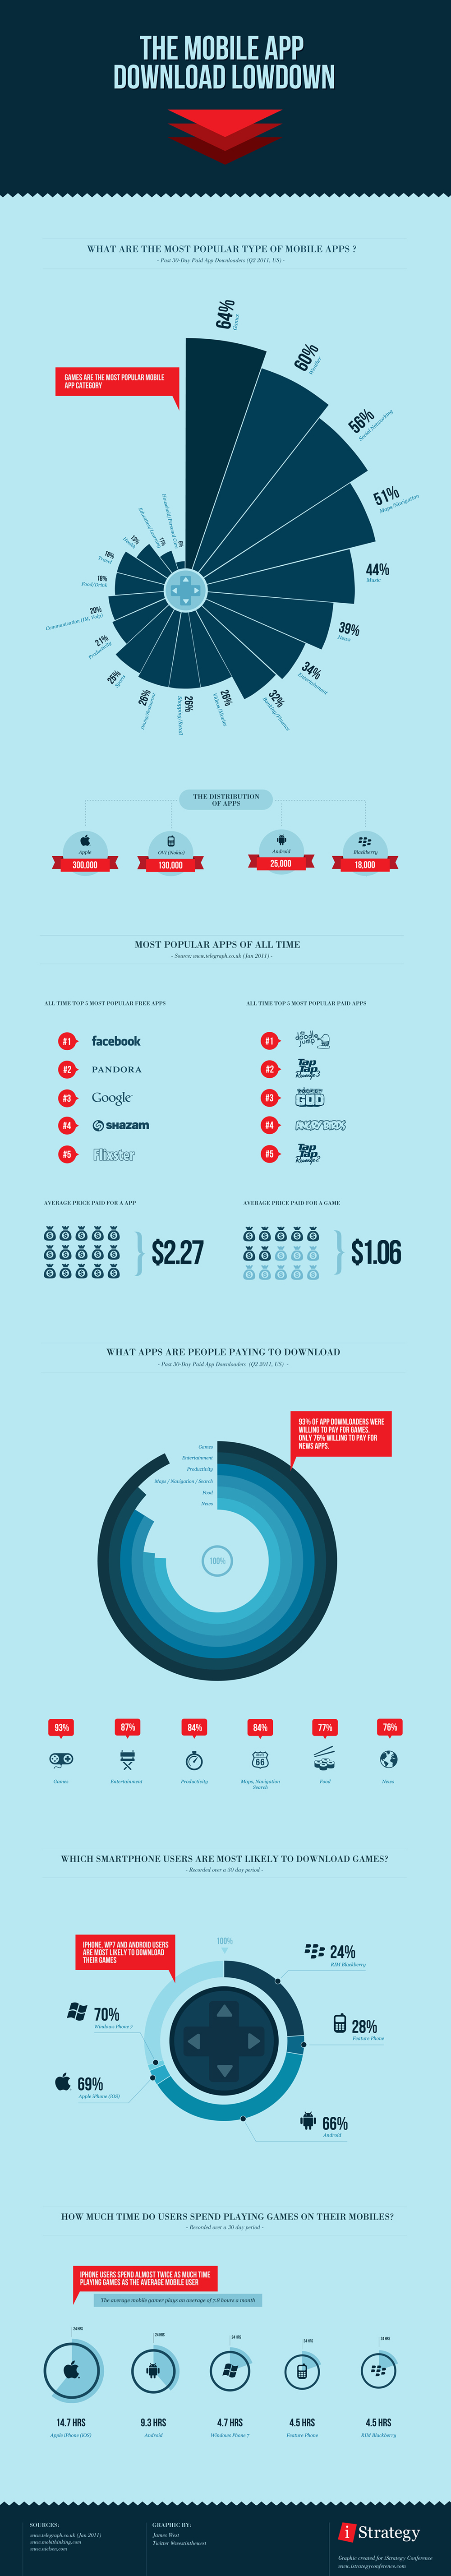
But the really astounding stat lies at the bottom of that chart: Despite all the noise about Android owning more market share than Apple, Apple has 300,000 apps available compared to Android's truly pitiful 25,000. You be the judge about whether that's because Apple was first or because developers find Apple apps easier to develop or because the device's users simply use more apps--it's hard to deny how significant a content lead Apple's iOS has over its competition.
Moving onto the next chunk of insights. You might think that since games dominate the app market, they would be the only things that people are willing to pay for. To some extent, that's true: The top five paid-for apps on the market are all games, while the top five free apps all have some sort of function:
There's a massive gap in the app market.But again, pay attention to the bottom-most charts in that panel (above). While 93% of people who paid for apps might be willing to pay for a game, 84% are also willing to pay for a productivity app and 77% are willing to pay for a food app. Compare that to the things that people actually bought, in the first panel we saw above: Only 21% actually bought a productivity app and only 18% actually bought a food app.
That means one of two things: Either people say they'll buy things they actually won't. Or: There's a massive gap in the app market. I find the latter option a bit more likely: As app developers have chased the dream of creating the next Angry Birds, they've left some huge gaps in the market. As I've argued before, we're coming to a point where if something is important to you, then it lives as an app on your phone. But developing all those applications is a far different task than developing a game: For one, you have to think in a deep way about the user, rather than just the user experience. In other words, building that new generation of apps is hard work. But that's where the real opportunities lie in the app market.
The last panel brings us to some different insights. But in many ways, this is the most surprising information of all. Check out the first chart: iPhone, Android, and Windows 7 users all download games at about the same rate. But iPhone users spend way, way more time actually playing those games:
I suspect that there's a few things going on here: For one, given the huge lead that Apple has in apps available, the games might simply be better.
But I would be there's something more subtle going on as well: People relate to their iPhone a bit differently. All you have to do is pick one up and compare it to the competition. You quickly realize that in many ways its a friendlier device, with a less complicated interface. It feels a lot less like a productivity tool than it does a window onto this big zoo of apps. That's a very subtle effect that arises from a slew of design details. But it's nonetheless true that those design details can change your attitude to a product--and how you use it.
Infographic Of The Day: Everything About The Mobile App Market | Co. Design

